
ServiceNow is a widely used ITSM platform for structuring support operations. The Incident module is one of its central components, as it concentrates a large portion of daily requests and directly influences the perception of service quality. As part of our work with a healthcare client, leveraging ServiceNow event data through process mining with Celonisenabled the achievement of rapid and measurable results, including a 29% reduction in incident resolution time in just five months. This article presents this experience and illustrates how analyzing the actual process execution makes it possible to identify bottlenecks, prioritize actions, and establish continuous improvement focused on lead times and operational performance.
1) ITSM Challenges with the ServiceNow Incidents Module
The Incidents module structures the ticket lifecycle: creation, assignment, status changes, resolution, and closure. Despite a defined workflow, execution varies based on categories, workload, and coordination between groups. These challenges translate into high turnaround times, pending tickets, and significant variability in ticket paths. Process mining provides an objective view of these gaps by reconstructing the process as it actually executes in ServiceNow, then measuring what contributes most to delays: extended wait times, loops, slow transitions, or reassignments.
2) Structuring ServiceNow Data for Process Mining
The analysis relies on transforming ServiceNow data into a usable event log. Each incident is represented by a unique identifier, a sequence of timestamped events, and segmentation attributes. Key events include: creation, first action, assignments, holds, resumptions, resolution, and closure. Attributes such as priority, category, or assignment group enable performance comparisons. This modelling step is critical: it determines the reliability of findings and the ability to translate results into targeted operational actions.
3) Dashboard Overview: Incident Management and Key Metrics
An overview dashboard was designed to manage incidents, with a focus on high priorities when needed. The metrics aim to remain clear and actionable: volume, average resolution time, assignment stability, and complementary measures that limit the influence of outliers, such as trimmed averages on certain sub-cycles. This view serves as an operational entry point: it highlights deviations, then directs analysis toward the segments, steps, or behaviours that explain the observed gaps.
4) Time Management: Trends and Duration Categorization
Tracking turnaround times over time is essential, but a simple average is rarely sufficient. A highly effective practice is to categorize durations into classes to facilitate interpretation and prioritization. For example: 0 to 1 week, 1 to 3 weeks, 3 to 5 weeks, 5 to 8 weeks (thresholds can be adapted to context). This approach makes populations of long-running cases visible, which often drive overall performance. It also helps identify periods when a growing share of incidents shifts into higher duration classes.
5) Bottlenecks: Time Between Transitions in ServiceNow
The analysis becomes truly actionable when it comes down to process transitions. Rather than simply observing creation → closure, we measured delays between successive steps, such as: assigned → in progress, in progress → on hold, on hold → resumed, resumed → resolved. This granularity pinpoints exactly which phases contribute to delays: extended waits, late resumptions, or slow assignments. Duration categorization reinforces this reading: a transition is problematic not only because of its average time, but also because of the share of cases that regularly fall into higher duration classes.
6) Analysis by ServiceNow Attributes: Categories, Groups, and Priority Segments
To make decisions, segmentation by ServiceNow dimensions is essential: category, assignment group, priority, service. These views identify high-volume segments, those with above-average turnaround times, and those with high variability. Duration categorization adds value here: it shows the distribution by segment, distinguishing fast cases from slow ones. This reading facilitates prioritizing initiatives and allocating efforts to the segments that contribute most to overall delays.
7) SLA Compliance: Detailed View and Root Causes
A dedicated view for SLA compliance was built, distinguishing response SLAs from resolution SLAs. The objective is to link compliance to ServiceNow attributes (group, category, service, priority) to identify segments that degrade performance and those that outperform. This reading supports operational governance: adjusting assignment rules, clarifying responsibilities, prioritizing actions, and tracking progress after improvements are implemented.
8) Celonis Exploration: Variants, Processes, and Case Analysis
Metrics highlight where to investigate, but exploration explains how gaps occur. The variant explorer identifies the most frequent paths and those associated with high durations, particularly when loops are present. The process explorer visualizes the actual flow and dominant transitions. The case explorer allows drilling down to individual incidents to validate a hypothesis or illustrate a phenomenon. Together, these provide a structured investigation capability based on ServiceNow data.
9) Customization and Comparison: Custom Metrics and Differential Analysis
Process mining enables adding custom metrics, such as measuring initial pickup time or analyzing configurable sub-cycles based on team needs. We also implemented comparative analysis: selecting an attribute, comparing two segments on chosen values, then explaining through a visualization of process differences. Duration categorization is also useful here, as it makes differences between segments visible and helps determine what to prioritize.
Conclusion
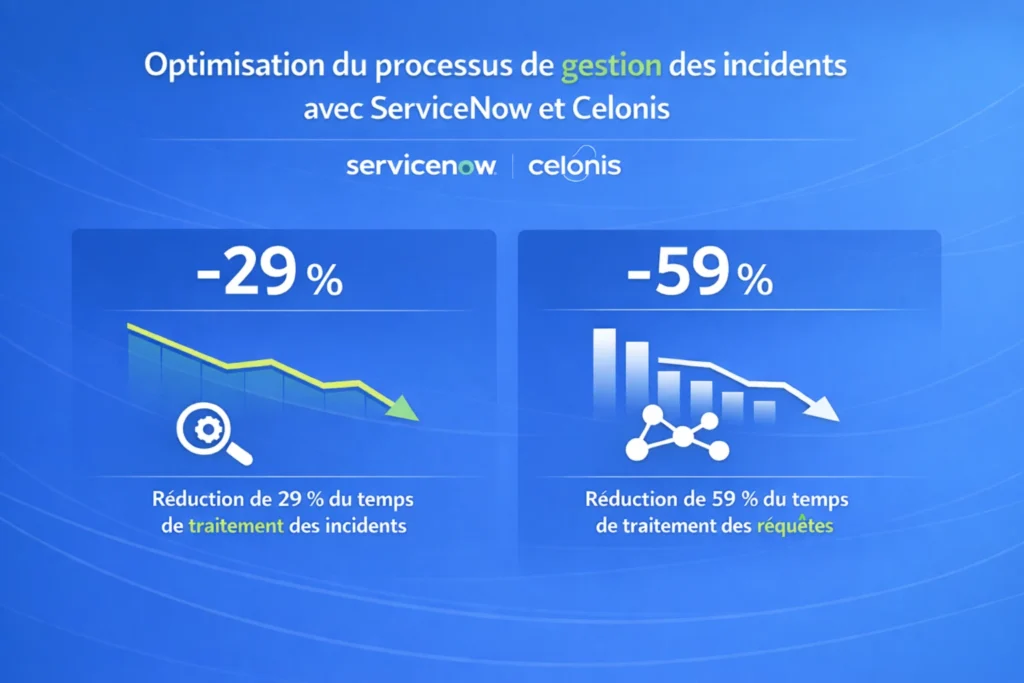
When ITSM gains performance through Process Mining, results become tangible quickly. Since deploying Celonis at a client site, we have closely tracked the evolution of incident and service request management.
Over a 5-month period, compared to the previous five months, the observed results are as follows:
- 59% reduction in service request resolution time
- 29% reduction in incident resolution time
These gains were achieved despite a 65% increase in service request volume, with incident volume remaining stable.
Beyond turnaround times, the benefits are also visible in operational excellence:
- 54% reduction in manual tasks on service requests, primarily through automation
- 48% reduction in service request task reassignments
And these results represent only the first level of value: process mining opens up many more optimization opportunities across all ITSM processes.